

Portfolio information
- Category: Monitoring Systems
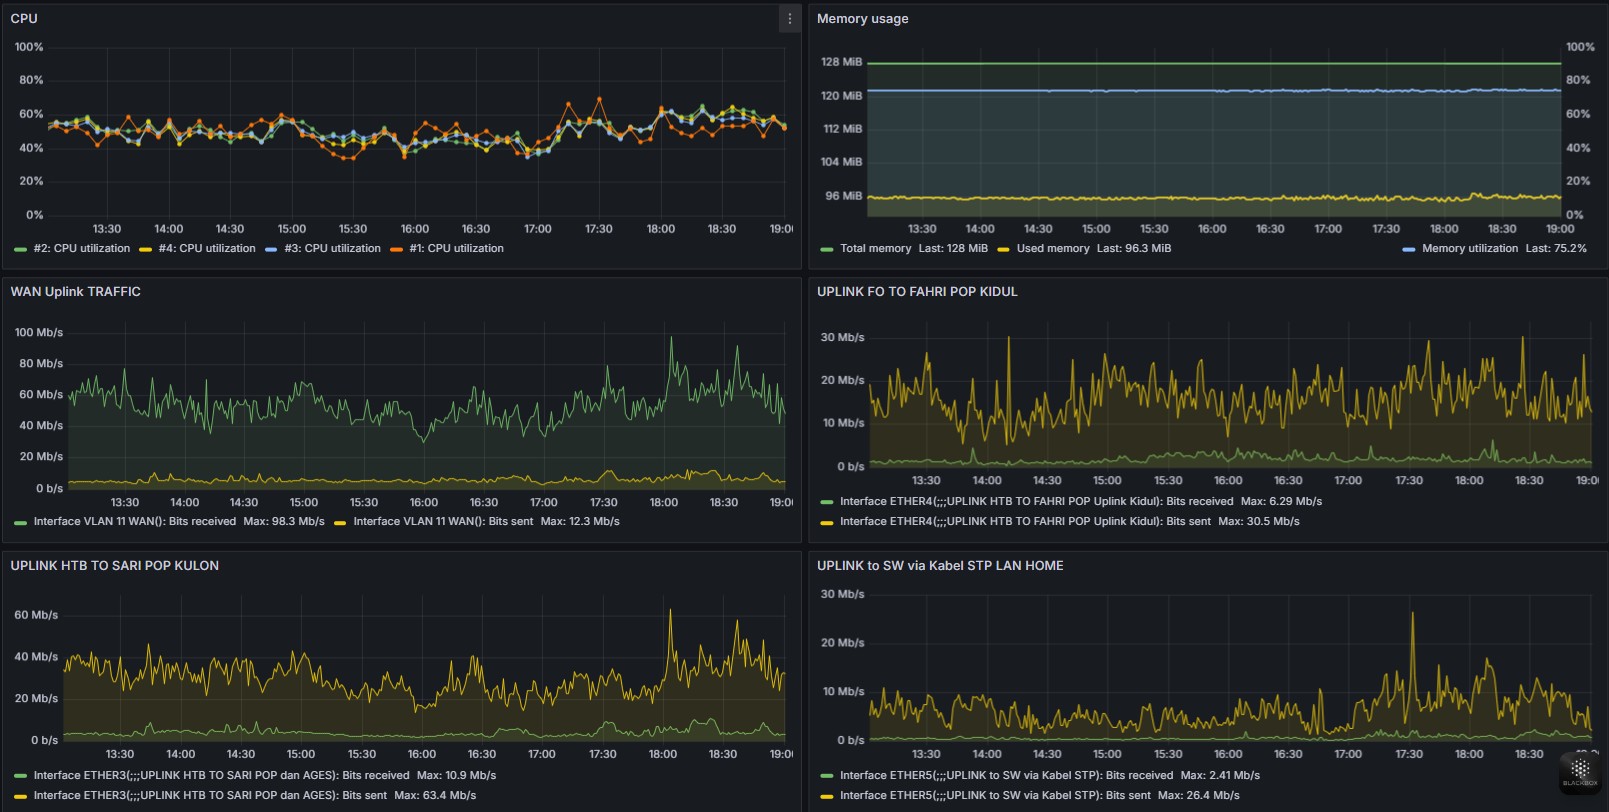
- Monitoring App: Grafana
This is the details of my Grafana Monitoring System implementation
I have successfully implemented and utilized Grafana as a powerful visualization tool for various monitoring systems. This includes creating dynamic and insightful dashboards that aggregate data from diverse sources, such as network devices, servers, and applications, to provide real-time operational intelligence. My experience with Grafana demonstrates my ability to design custom visualizations, configure alerts, and interpret complex data trends, enabling proactive identification and resolution of potential issues within IT environments. This skill is crucial for maintaining system stability and optimizing performance across infrastructures.